Earned Value Analysis
Earned Value Analysis (EVA), part of the broader discipline of Earned Value Management (EVM), is a concept and technique in project management for measuring project performance and progress in an objective way.
Why Earned Value Analysis is Important
Say a given project is 30% complete according to schedule and has used 30% of the budget. It may be natural to assume that the project is on track; however, if only 15% of the work has been done, then the project is in peril. EVA seeks to address the shortcomings in measuring only schedule and cost by measuring value earned according to the progress on the project’s budgeted tasks.
Basics of Earned Value Analysis
EVA uses three standard metrics as inputs from which many other project measures can be derived:
- Planned Value (PV): The estimated cost for the planned work.
- Earned Value (EV): The value of the work actually completed.
- Actual Cost (AC): The cost incurred for the performed work.
These three measurements can be plotted on a grid, with time on the x-axis and dollars on the y-axis.
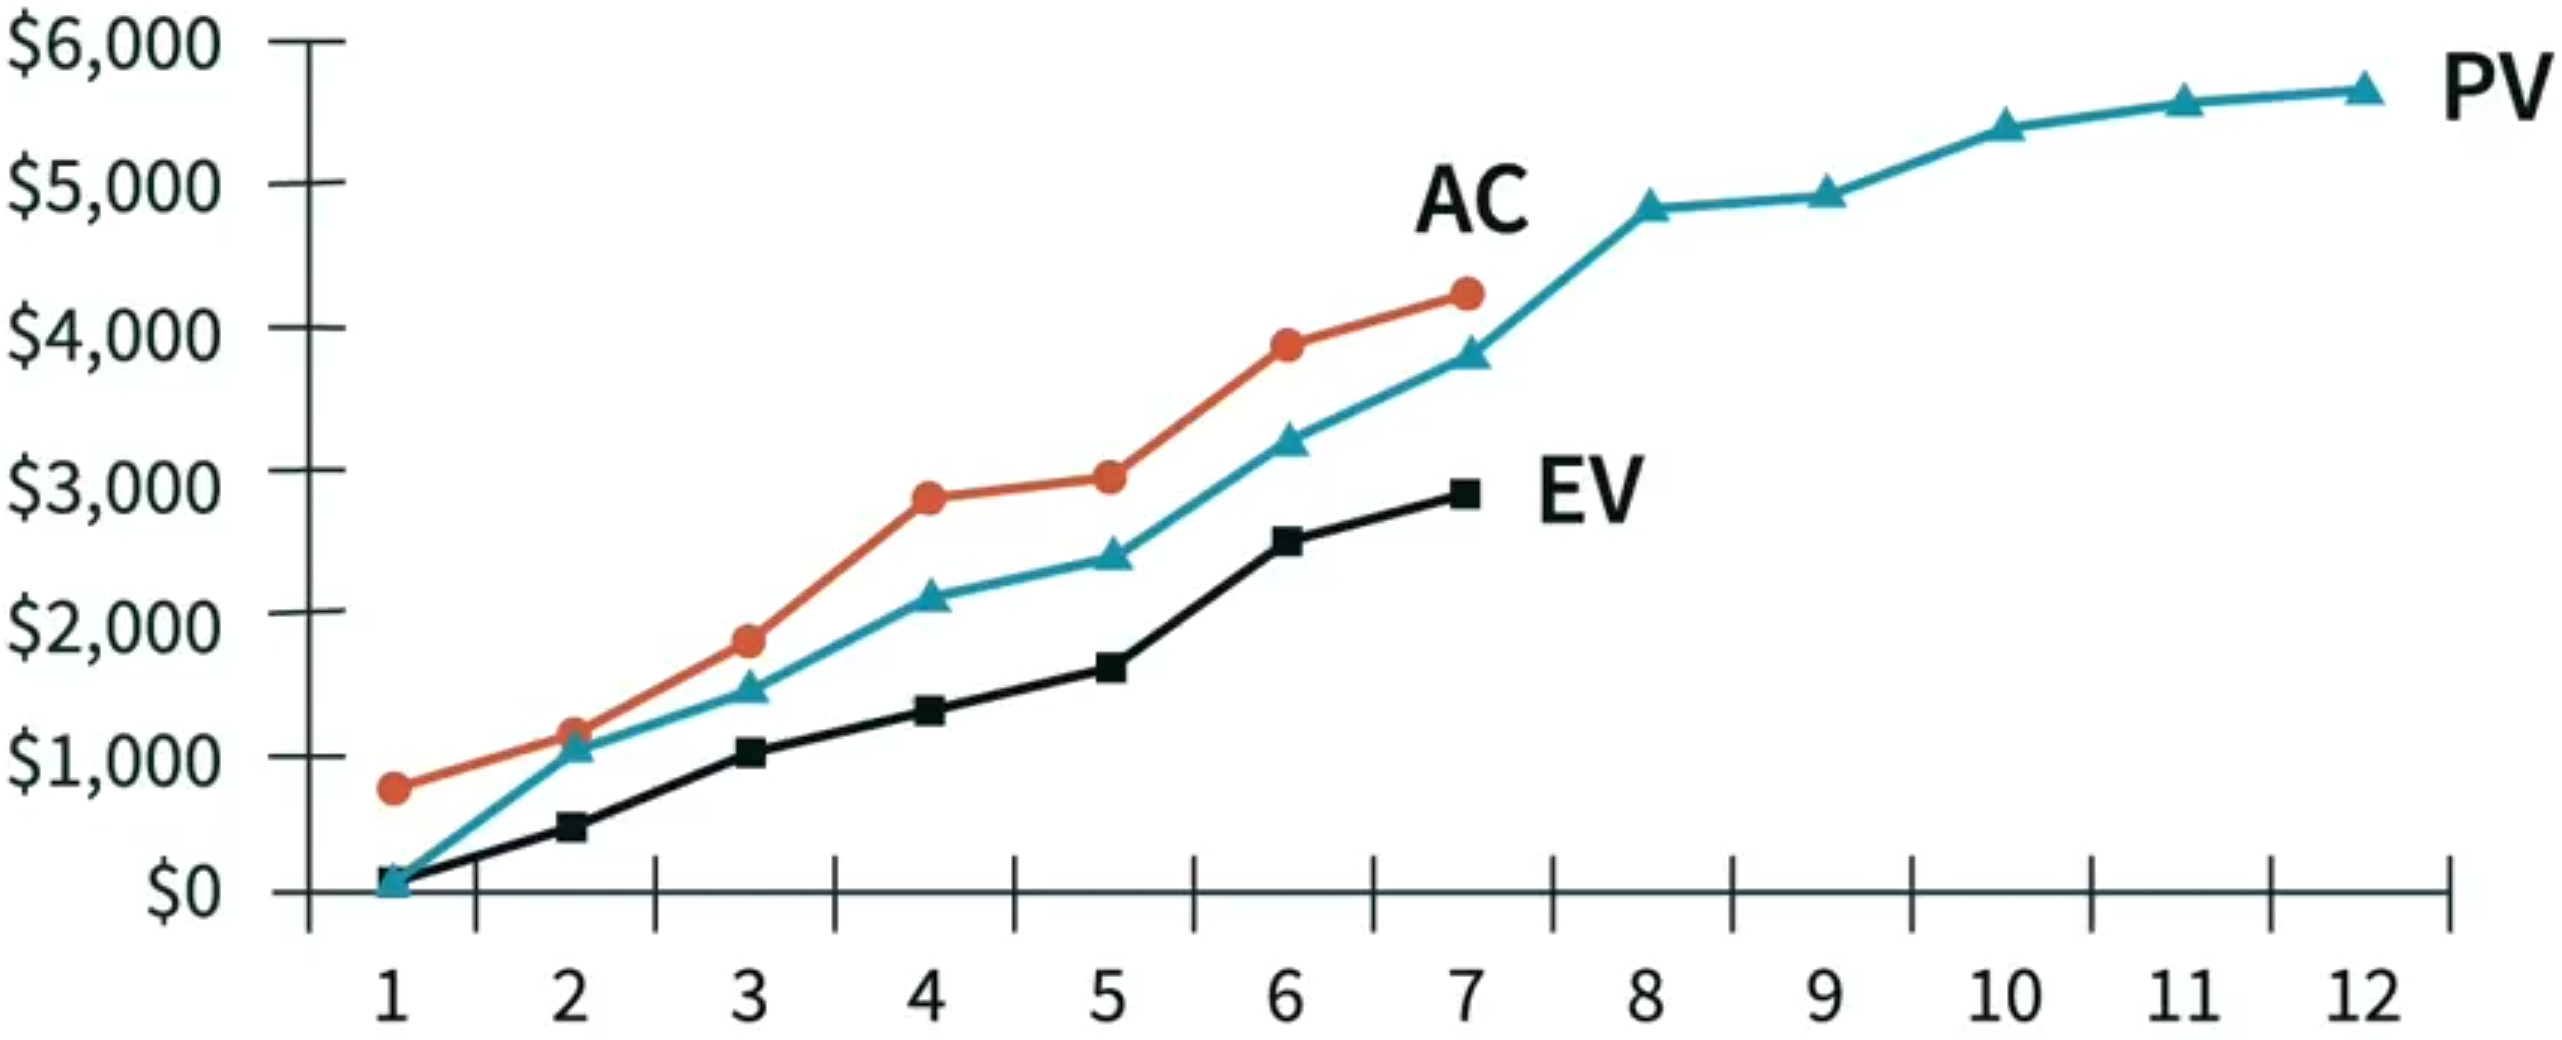
The project shown in the example above is over budget, since AC exceeds EV. Additionally, it is behind schedule, as the EV is less than the PV.
Planned Value and Earned Value
PV represents the planned amount of work done at a given point in the project. It is also called Budgeted Cost of Work Scheduled (BCWS). It is calculated by assigning a budget to each task on the work breakdown structure (WBS) of the project. There are alternate ways to calculate PV, such as assigning a value to milestones instead of tasks. Regardless of the method chosen, the PV can be charted from the start of the project to the end to show the project baseline over time.
EV represents the actual amount of work done at a given time in the project. EV is also called the Budgeted Cost of Work Performed (BCWP). EV is found by multiplying the Budget at Completion (BAC) by the percent complete of each task. As the team works on tasks, they “earn” the budgetary value of that task.
Schedule Variance and Cost Variance
Once you have the total values on a project for PV, EV, and AC, you can determine whether the project is on track by calculating the variance to plan. The difference between the EV and the PV is called the Schedule Variance (SV). The difference between the EV and the AC is referred to as the Cost Variance (CV). Both the SV and the CV are expressed in terms of dollars.
Schedule Variance:
Cost Variance:
A negative value for SV indicates that the project is behind schedule. A negative value in CV indicates that the project is over budget.
Other Valuable Status Indicators
Cost Performance Index
Cost Performance Index (CPI) is a measurement of the budget performance of a project at a given time. The calculation is:
where earned value at a given time is divided by actual cost incurred at that same time.
- CPI > 1 means the project is under budget.
- CPI = 1 means the project is on budget.
- CPI < 1 means costs are higher than expected.
A CPI of .90 means a project is 10% over budget.
Schedule Performance Index
Schedule Performance Index (SPI) is a measurement of the schedule performance of a project at a given time. The calculation is:
where earned value at a given time is divided by PV at that same time.
- SPI > 1 means the project is ahead of schedule.
- SPI = 1 means the project is on schedule.
- SPI < 1 means the project is behind schedule.
An SPI of 1.10 means the project is 10% ahead of schedule.
Forecast Indicators
In addition to providing a snapshot in time and historical trends, EVA can also be used to forecast future project performance.
Estimate at Completion and Estimate to Complete
Estimate at Completion (EAC) provides the estimated cost of the final project based on budget and schedule variances to date. The EAC is used to determine the Estimate to Complete (ETC), which is the amount of money required to complete the project. There are multiple ways to calculate EAC, and the most appropriate method must be chosen based on the project performance and what is anticipated in the future.
If past project performance is expected to continue, divide the Budget at Completion (BAC) by the CPI:
If past project performance is considered unusual, and future performance will revert to the planned rate:
If the cost and schedule performance both factor into the future performance (the previous formulas used only the cost performance):
If something unexpected has arisen, and you need to throw out the original estimate and produce a new one, start with the AC already spent:
Once you have determined the EAC, finding the ETC is simple:
To Complete Performance Index
The To Complete Performance Index (TCPI) tells you how efficiently the project needs to run in the future to meet the original plan. TCPI can be calculated in the following ways:
To finish on the original budget:
To finish on the revised budget if current project performance continues:
For example, a TCPI of 1.03 indicates that the project needs to be 3% more efficient to finish on target.
How to Perform EVA
- Determine the percent complete of each task
- Determine Planned Value
- Determine Earned Value
- Obtain Actual Cost
- Calculate Schedule Variance
- Calculate Cost Variance
- Calculate Other Status Indicators
1. Determine the Percent Complete of Each Task
The first step is to determine the percent complete of each task using the most appropriate method according to task type.
Assume today is January 6, and we have three tasks that are to take place from January 1 to January 10.
| Task Name | Start Date | End Date | BAC | Percent Complete |
|---|---|---|---|---|
| Task A | 1/1 | 1/10 | $1000 | 20% |
| Task B | 1/1 | 1/10 | $5000 | 50% |
| Task C | 1/1 | 1/10 | $3000 | 100% |
2. Determine Planned Value
Let’s assume that these tasks progress linearly. Since today is January 6, all three tasks should be 60% done. Multiply the budget for the task by the time elapsed to find the PV.
| Task Name | Start Date | End Date | BAC | Percent Complete | PV |
|---|---|---|---|---|---|
| Task A | 1/1 | 1/10 | $1000 | 20% | $600 |
| Task B | 1/1 | 1/10 | $5000 | 50% | $3000 |
| Task C | 1/1 | 1/10 | $3000 | 100% | $1800 |
Note that in the real world, tasks don’t always progress linearly. For example, let’s take a task to set up a database. Let’s say the task is scheduled from 1/1 to 1/10, but 20% of the work labor costs are incurred in the first five days and 80% of the labor costs are incurred in the last five days. Assuming the total cost is $10,000, and you want to calculate the PV as of 1/8, you could manually calculate PV using the following calculation:
3. Determine Earned Value
To find the Earned Value (EV), also called the Budgeted Cost of Work Performed (BCWP), multiply the budget (BAC) for the task by the percent complete of the task.
| Task Name | Start Date | End Date | BAC | Percent Complete | PV | EV |
|---|---|---|---|---|---|---|
| Task A | 1/1 | 1/10 | $1000 | 20% | $600 | $200 |
| Task B | 1/1 | 1/10 | $5000 | 50% | $3000 | $2500 |
| Task C | 1/1 | 1/10 | $3000 | 100% | $1800 | $3000 |
4. Obtain Actual Cost
Obtain the actual costs by task of labor and other costs (materials, software, vendor fees, etc.)
| Task Name | Start Date | End Date | BAC | Percent Complete | PV | EV | AC |
|---|---|---|---|---|---|---|---|
| Task A | 1/1 | 1/10 | $1000 | 20% | $600 | $200 | $250 |
| Task B | 1/1 | 1/10 | $5000 | 50% | $3000 | $2500 | $2200 |
| Task C | 1/1 | 1/10 | $3000 | 100% | $1800 | $3000 | $3500 |
5. Calculate Schedule Variance
Determine the SV of the project by subtracting the PV from the EV. A negative SV means the task is behind schedule. A positive SV means it is ahead of schedule.
| Task Name | Start Date | End Date | BAC | Percent Complete | PV | EV | AC |
|---|---|---|---|---|---|---|---|
| Task A | 1/1 | 1/10 | $1000 | 20% | $600 | $200 | $250 |
| Task B | 1/1 | 1/10 | $5000 | 50% | $3000 | $2500 | $2200 |
| Task C | 1/1 | 1/10 | $3000 | 100% | $1800 | $3000 | $3500 |
| $5400 | $5700 |
In this example, the SV of the project is 5700 - $5400), meaning the project is slightly ahead of schedule.
6. Calculate Cost Variance
Determine the CV of the project by subtracting the AC from the EV. A negative CV means the project is over budget. A positive CV means the project is under budget.
| Task Name | Start Date | End Date | BAC | Percent Complete | PV | EV | AC |
|---|---|---|---|---|---|---|---|
| Task A | 1/1 | 1/10 | $1000 | 20% | $600 | $200 | $250 |
| Task B | 1/1 | 1/10 | $5000 | 50% | $3000 | $2500 | $2200 |
| Task C | 1/1 | 1/10 | $3000 | 100% | $1800 | $3000 | $3500 |
| $5400 | $5700 | $5950 |
In this example, the CV of the project is -5700 - $5950), meaning the project is slightly over budget.
7. Calculate Other Status Indicators
After deriving the SV and CV, you can use these measures to determine other valuable status indicators:
- Schedule Performance Index
- Cost Performance Index
- Estimate at Completion
- Estimate to Complete
- To Complete Performance Index
References
- https://www.projectengineer.net/the-8-steps-to-earned-value-analysis/
- https://www.projectengineer.net/the-earned-value-management-system/
- https://en.wikipedia.org/wiki/Earned_value_management
- https://pmstudycircle.com/planned-value-pv-earned-value-ev-actual-cost-ac-analysis-in-project-cost-management-2/
- https://www.youtube.com/watch?v=o_BG-wxLGzg
testing